You've been putting real time and money into your marketing. Don't you want to know if it's paying off? Enji's KPI dashboard pulls all your numbers into one place—no spreadsheets or math required. See the trends, make better decisions, and close the loop on the marketing plan you've been executing. Plan it. Do it. Know it worked.

According to Enji's own State of Small Business Report, small business owners who make marketing decisions with their numbers in mind are 2.8x more likely to rate their marketing as very or extremely effective. Not marginally more likely. Nearly three times more likely. That's the difference between marketing that feels like a shot in the dark and marketing that feels like it's actually working. And it starts with knowing what to track— which is exactly what Enji helps you figure out.

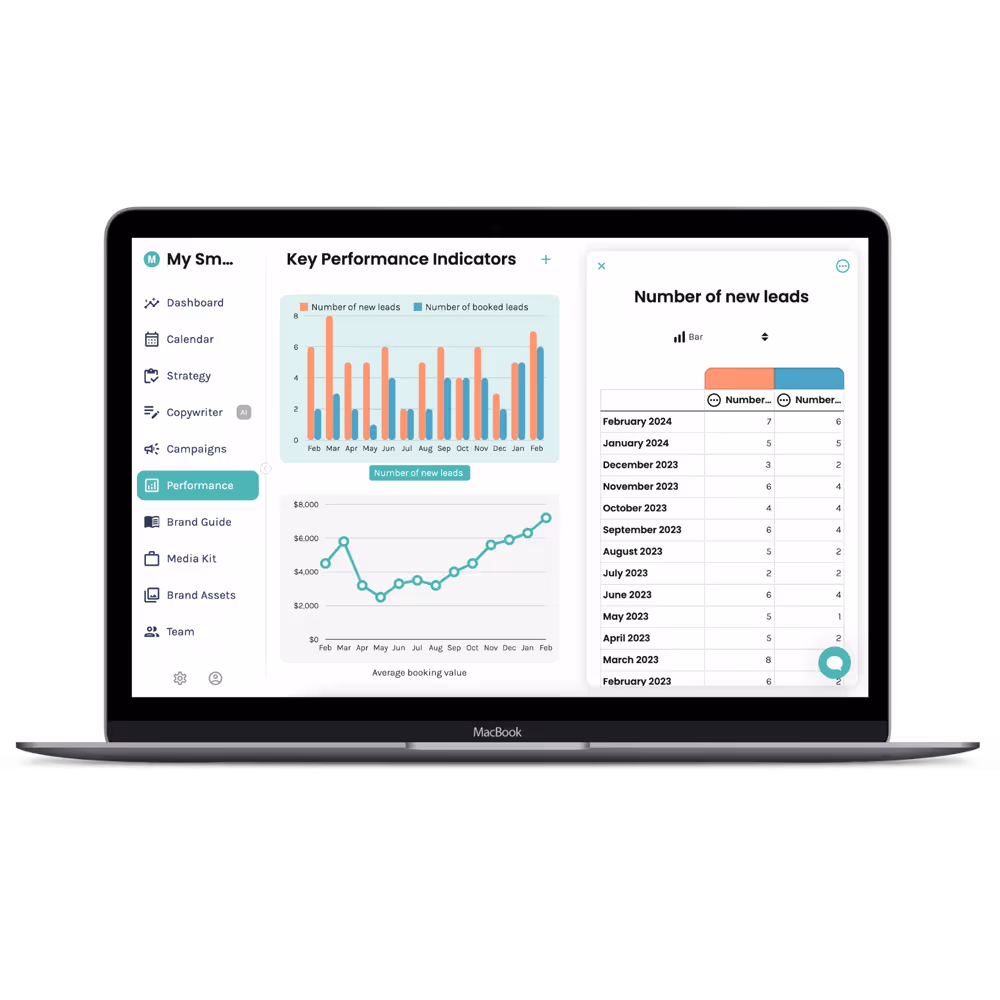
Enji turns your marketing metrics into clean, visual graphs that make trends impossible to miss — even if spreadsheets make your eyes glaze over. Connect your accounts and most of your numbers populate automatically every month. You show up, you look at the dashboard, and you actually know what's going on with your marketing. No formulas. No hunting through four different apps. Just understanding what the heck is going on.

If all you can do in a spreadsheet is highlight cells to get a sum, Enji's KPI dashboard is going to be your new best friend. Numbers go in, graphs come out, and the trends you need to see are suddenly impossible to miss. Spot a peak, notice a valley, and know exactly where to focus next.
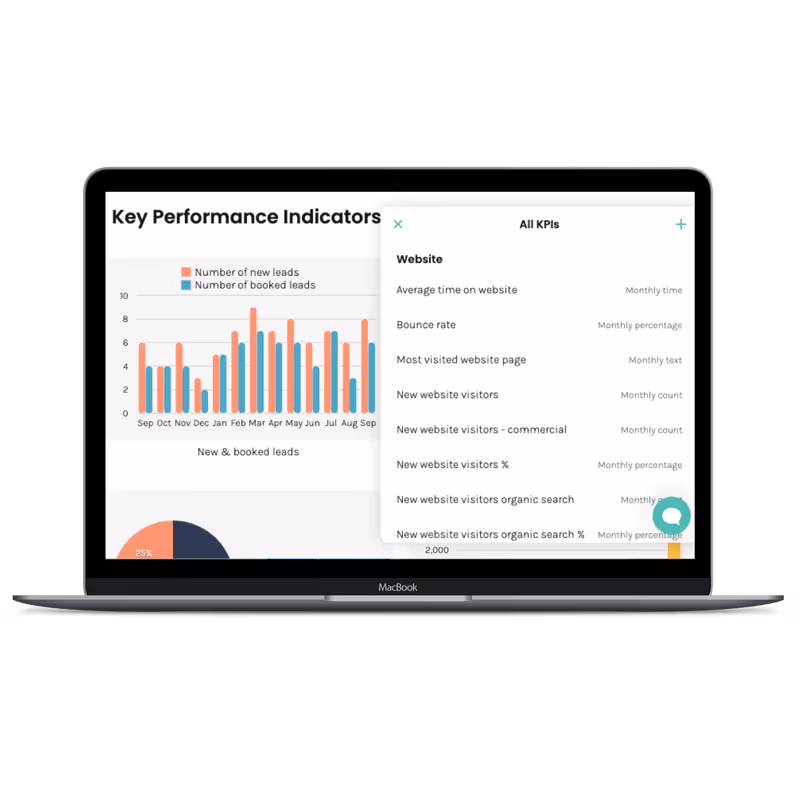
Most analytics tools show you every metric imaginable and leave you to figure out which ones actually matter for your business. Enji does the opposite — it recommends the specific KPIs you should be tracking. No guessing. No Googling. Just a clear list of the numbers that will tell you whether your marketing is moving the needle.
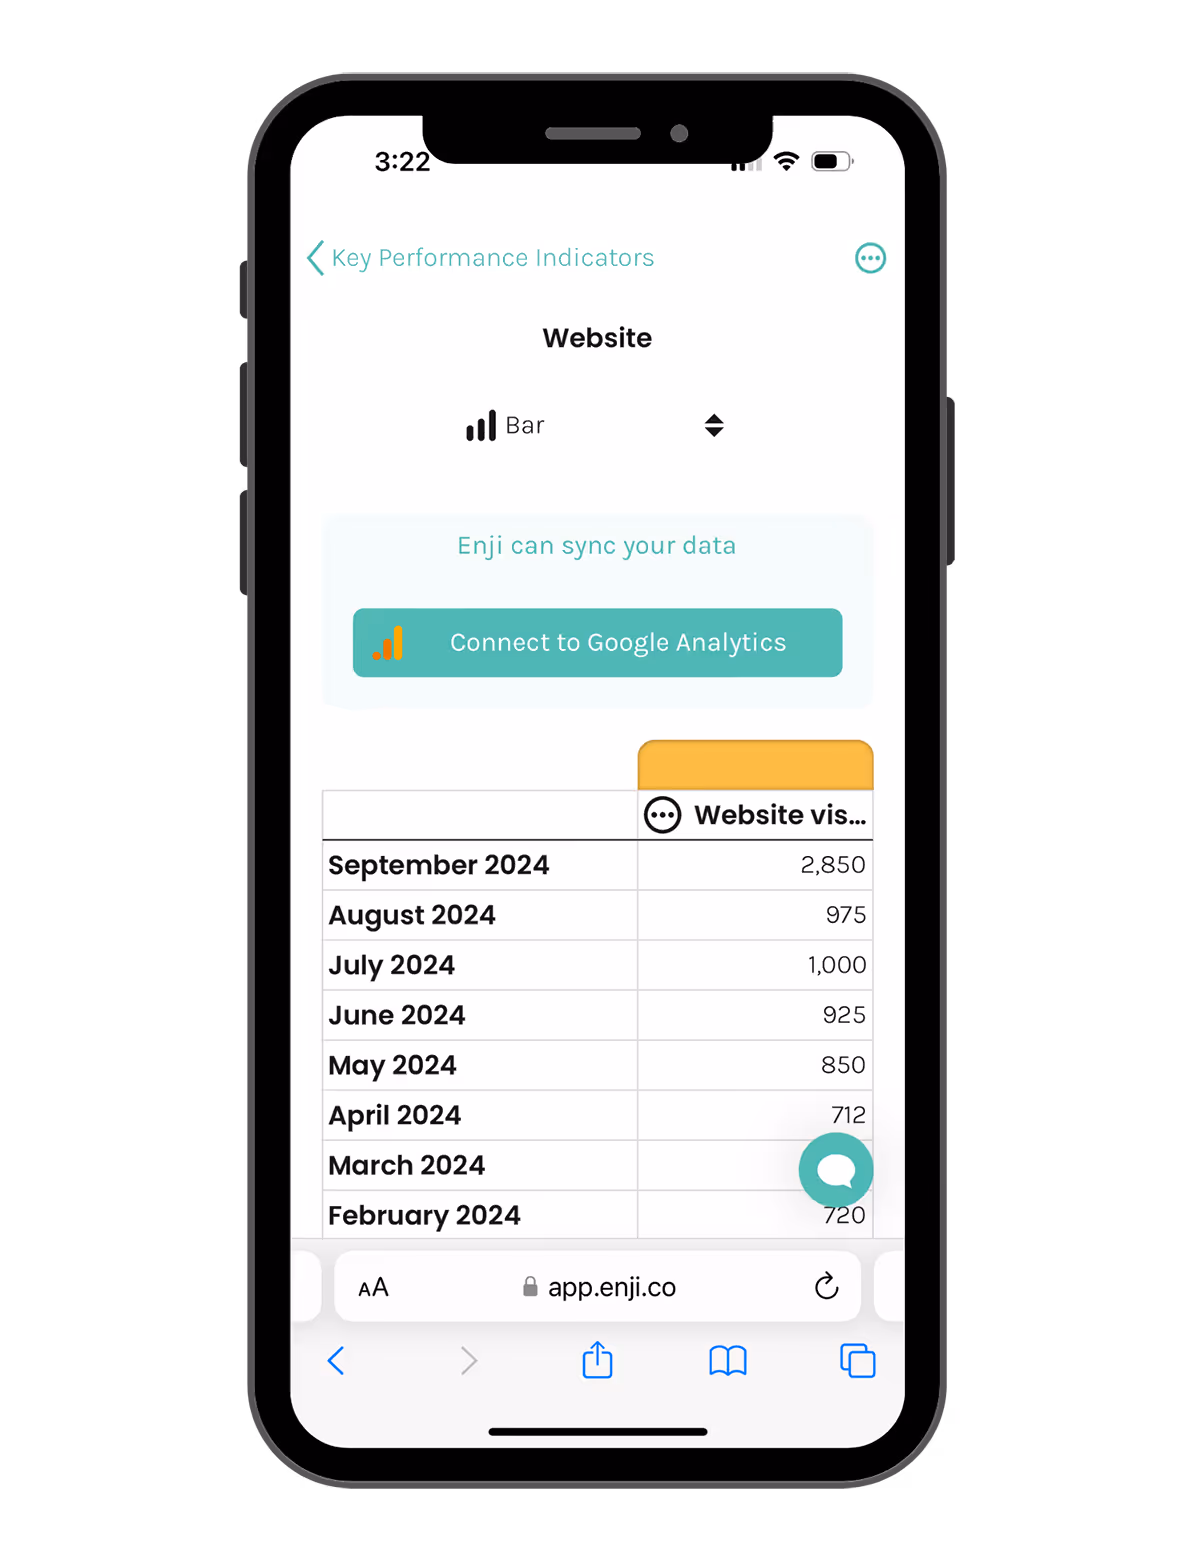
Enji integrates directly with Google Analytics, Meta, Instagram, Pinterest, LinkedIn, and YouTube—which means most of your KPIs auto-populate every month without you having to do a thing. You're tracking your marketing even on the months where you barely had time to do your marketing (which Enji helps you not do). And on the first of the month, your dashboard is waiting for you with everything you need to make smarter decisions going forward.
We know what you're thinking. Go ahead and sign up anyway—you'll see.


The first of every month just got a lot more satisfying. Small business owners across the country open Enji on KPI day to see what their marketing actually did—and make decisions from a place of confidence instead of guesswork.


KPI stands for Key Performance Indicator. KPIs are the numbers that help you understand the health of your business and impact of your marketing.
Enji's own State of Small Business Report found that small business owners who make marketing decisions with their numbers in mind are 2.8x more likely to rate their marketing as very or extremely effective. Tracking KPIs isn't just a best practice—it's one of the clearest predictors of whether your marketing actually works.
Tracking KPIs (and looking at them monthly) helps you start to see trends as to what is working with your marketing and what is not. These trends or patterns then help you make decisions about what marketing you can do more of, what you can do less of, what you can cut, and what you should think about trying to fix.
Enji allows you to create an easy-to-understand KPI dashboard that includes your sales and marketing KPIs in one place. It is easy to read because Enji creates graphs and charts from your numbers—most of which can be directly pulled in from integrations. This helps you have a birds eye view into your business and make better decisions.
No, Enji does integrate with platforms such as Google Analytics, Meta, and many others to pull your KPIs in automatically every month.
When you track KPIs monthly, you stop making marketing decisions based on gut feelings and start making them based on what's actually working. More of what's getting results, less of what isn't — and a clear picture of where to put your energy next. Because Enji's dashboard lives in the same platform as your marketing plan, you can go straight from reviewing your results to adjusting your strategy without ever leaving Enji.
The whole point of building a marketing plan, creating content, and showing up consistently is to grow your business. Enji closes the loop—so you're not just doing the marketing, you're learning from it. Start your free trial today and find out what it feels like to actually know if your marketing is working.
Start For Free